Strong Tableau authors fail Analytics-Con-301 more often than they expect, because it examines judgement rather than execution. The Salesforce Certified Tableau Consultant exam runs 60 questions in 105 minutes, asks for 63 percent to pass, and costs $200 to register with a $100 retake fee, all through Pearson VUE.
Read the objectives closely and something unusual shows up. They start with Recommend. Evaluate. Plan. Troubleshoot. Almost none of them start with Create or Build. This is the one Tableau credential that examines judgement rather than execution, which is why strong Tableau authors sometimes fail it and why unremarkable authors with consulting experience sometimes sail through. This article works through the four domains, explains what the advisory framing means for each, and separates this exam from the Data Analyst credential it is routinely confused with.
What Makes the Tableau Consultant Credential Different?
It examines advice rather than output. Analytics-Con-301 asks whether you can look at an existing analytics estate, judge what is wrong with it, and recommend a defensible way forward. The four domains cover evaluating current state, planning data connections, designing and troubleshooting calculations and workbooks, and establishing governance.
That is a different job from producing a dashboard. A consultant arrives at an organisation that already has Tableau, already has data structures of varying quality, and already has opinions. The exam simulates that: most questions describe a situation and ask which course of action fits it.
Where it sits in the Tableau track
The 301 numbering places it at the top of the ladder alongside the Architect credential. Below it sit Desktop Foundations, Data Analyst, and Server Administrator. Those examine what you can do with the product. This one examines what you would tell a client to do with it. We cover that sibling credential in our guide to the Tableau Architect exam.
Why Do the Objectives Say Recommend Rather Than Build?
Because the syllabus was written around an advisory role, and the verbs are deliberate. Objectives ask you to recommend a data transformation strategy, recommend whether to use Tableau Server or Tableau Cloud, recommend an advanced chart type, recommend calculations that should be moved upstream, and recommend a governance strategy. Building is assumed; choosing is examined.
The practical consequence is that memorising menu paths will not help you. A question that gives you three plausible ways to connect to a data source is not testing whether you know they exist. It is testing whether you can say which one suits a stated constraint and why the other two do not.
What that means for how you revise
For every feature on the syllabus, learn the trade-off rather than the procedure. Row-level security has several approaches, and the exam asks you to compare them. Extracts and live connections both work, and the exam asks which fits a given refresh and volume profile. The comparison is the answer.
What Are the Four Domains and How Are They Weighted?
Design and Troubleshoot Calculations and Workbooks takes 40 percent. Evaluate Current State and Plan and Prepare Data Connections take 22 percent each. Establish Governance and Support Published Content takes the remaining 16 percent. On a 60 question paper the pass mark of 63 percent means 38 correct answers.
| Domain | Weight | Approximate questions | What it asks you to do |
|---|---|---|---|
| Design and Troubleshoot Calculations and Workbooks | 40% | 24 | Recommend chart types, reason about order of operations, build advanced calculations, diagnose performance |
| Evaluate Current State | 22% | 13 | Map business needs to capabilities, choose Server or Cloud, assess existing data structures and lineage |
| Plan and Prepare Data Connections | 22% | 13 | Design row-level security, pick a connection method, set granularity and aggregation strategy |
| Establish Governance and Support Published Content | 16% | 10 | Secure content access, certify data sources, configure quality warnings, use administrative views |
The two 22 percent domains deserve more attention than their weighting suggests, because they are where the advisory framing bites hardest. Full topic detail and the current question format sit on the money site’s Tableau Consultant exam page.
What Does Evaluating Current State Involve?
Seven objectives across two clusters. The first maps an organisation’s current analytics position onto Tableau’s capabilities, including whether Tableau Server or Tableau Cloud is the right platform and how a migration or a Server upgrade should be planned. The second evaluates existing data structures for fitness, lineage, and performance risk.
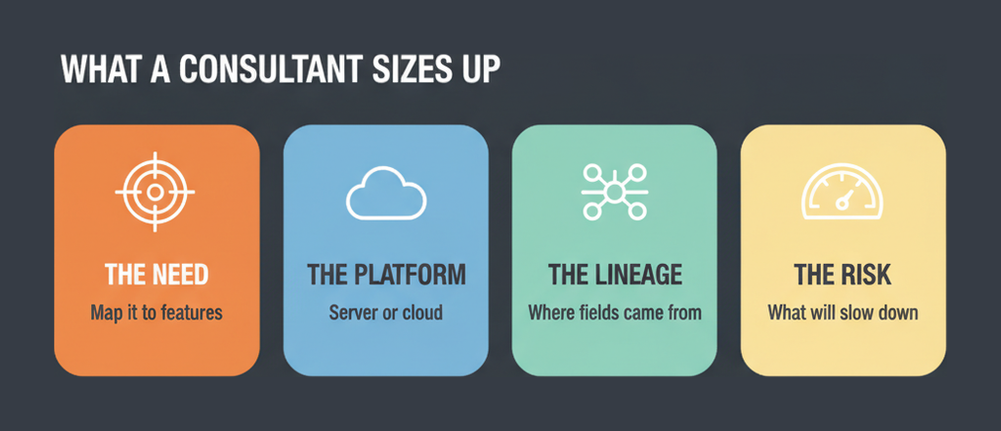
The Server against Cloud recommendation is the objective candidates underestimate. It is not a feature comparison. It is a question about data residency, network topology, in-house administration capacity, upgrade appetite, and cost model, and the right answer changes with the scenario.
Lineage as an examinable subject
Evaluating the lineage of existing data structures means tracing where a field came from, what transformed it, and what depends on it now. A consultant who cannot do that cannot safely recommend a change, because they cannot predict what breaks. Expect scenario questions where the correct recommendation depends on an upstream dependency you are told about in passing.
The third cluster of this domain, evaluating structures for performance risk and enhancement opportunity, connects directly to the workbook performance objectives later in the syllabus. Studying them together saves time.
How Deep Does Row Level Security Go?
Deep enough to design it, not just switch it on. The syllabus asks you to design a row-level security data structure, implement RLS with an entitlement table, identify group functions against user functions, and compare RLS approaches. That is four objectives inside a 22 percent domain, which makes it the single densest subject on the paper.
An entitlement table is the centre of it. Instead of writing a filter that hardcodes who sees what, you build a table that maps users to the rows they are entitled to, then join it into the data source so the filter becomes data rather than logic. It scales, it is auditable, and it survives staff changes.
Group functions against user functions
The distinction matters because it decides where the maintenance burden sits. User-level functions resolve against the individual and are precise but numerous. Group-level functions resolve against membership and are coarser but far easier to administer at scale. The exam expects you to choose between them for a stated organisation size and turnover.
Tableau documents the available approaches side by side in its row level security overview, which is the closest thing to a comparison table the vendor publishes and maps almost objective for objective onto this part of the syllabus.
Which Calculations and Chart Types Are Named?
The syllabus is unusually specific. Named chart types are Sankey, chord, radar, tile map, small multiples, and data densification. Named calculation techniques are aggregations that include dimensions, advanced table calculations such as window, nested table and multi-directional, advanced date functions such as fiscal calendars, and nested level of detail expressions.
Every one of those is on the list because it is not native. A Sankey in Tableau is constructed, not selected from a chart picker. Data densification is a side effect of how Tableau fills gaps in a domain. The exam is testing whether you know which visual problems justify that construction effort and which do not.
Order of operations is the hinge
Two separate objectives cover the Tableau order of operations: identifying its effect on calculations, and troubleshooting issues it causes. That duplication is a signal. Most confusing Tableau behaviour, from a context filter that changes an LOD result to a table calculation that ignores a dimension filter, traces back to the sequence in which filters and calculations are applied.
Tableau’s own order of operations reference lays out that sequence, and it is worth knowing well enough to reproduce from memory, because several question types collapse into arithmetic once you can.
Interactivity as design, not decoration
Dynamic URL actions, parameter actions, and filter actions each appear as advanced interactivity techniques. The exam frames them as ways to build a guided analytical path rather than as features to add. Expect to be asked which action type achieves a stated user journey.
What Does the Exam Expect on Performance?
Diagnosis first, then remedy. Six objectives cover performance: identifying resource-intensive queries, maximising caching for Tableau Server, resolving issues caused by string comparisons, IF THEN statements and LOD expressions, recommending calculations that should move upstream, interpreting performance recordings, and resolving issues caused by design elements.
The design elements objective names three specific culprits: the number of sheets in a workbook, the number of filters, and image size. Those are unglamorous and they are what actually slows real dashboards down, which is a good indication of how practical this domain is.
Moving calculations upstream
One objective asks you to recommend calculations that should be moved upstream of Tableau. The reasoning is that anything computed once during preparation costs nothing at view time, whereas a row-level string comparison evaluated per render costs on every interaction. Knowing where the boundary sits between preparation work and visualisation work is a consultant skill rather than an author skill.
Performance recordings are named explicitly as the diagnostic tool, so expect at least one question that shows you an event breakdown and asks what it indicates. Learn to read query execution, connecting to data source, and computing layout as three distinct signals.
How Is Governance Examined?
As a set of recommendations, in keeping with the rest of the paper. The 16 percent domain asks you to map organisational governance requirements onto Tableau features, recommend a strategy for securing access to content, recommend a data quality strategy, and use administrative views to answer questions about the deployment.
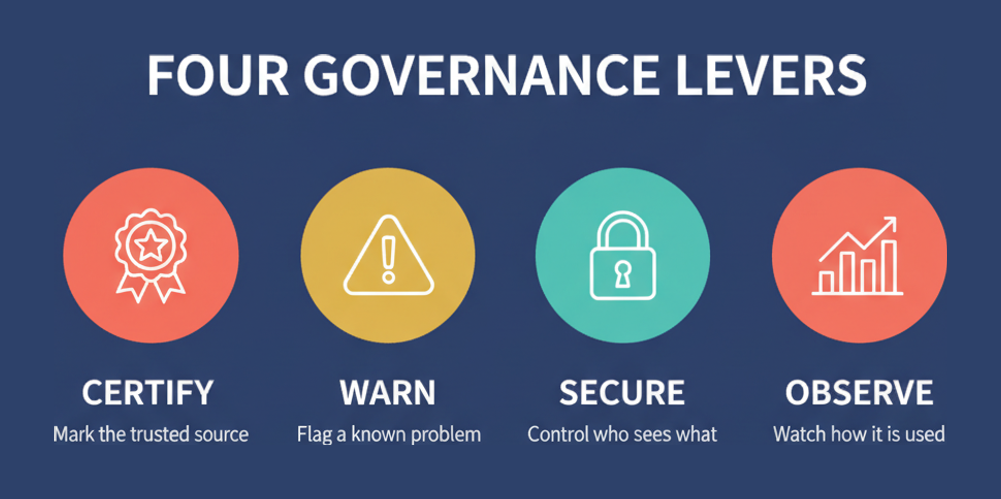
Data quality has three named levers: certifying data sources so users can tell which to trust, minimising data proliferation so the same measure does not exist in nine places, and configuring data quality warnings so a known problem is visible at the point of use rather than in an email. The vocabulary here is standard data management practice rather than anything Tableau invented, and DAMA body of knowledge sets out the same certification, quality and stewardship ideas in a vendor neutral form.
Administrative views
Two objectives cover them: specifying which insights require an administrative view, and recommending the appropriate view and data source for a scenario. This is deployment observability. Who is using what, which content is stale, which extracts are failing, and which workbooks are consuming the most resources.
Readers building a broader picture of the Tableau credential family will find the full set covered on BigDataPrep’s Tableau certification hub, which maps the entry level credentials alongside the 301 tier.
What Is the Exam Format, Cost and Retake Fee?
Sixty questions in 105 minutes, a 63 percent pass mark, a $200 registration fee and a $100 retake fee, delivered through Pearson VUE. The 105 minute allowance is longer than most 60 question exams, which fits a paper built on scenario questions that take real reading.
| Specification | Detail |
|---|---|
| Exam name | Salesforce Tableau Consultant |
| Exam code | Analytics-Con-301 |
| Questions | 60 |
| Duration | 105 minutes |
| Passing score | 63% |
| Registration fee | $200 USD |
| Retake fee | $100 USD |
| Registration | Pearson VUE |
The published retake fee at half the registration price is worth noting, because it changes the calculus on booking early. Two named learning paths are recommended, Analyst and Designer, and the credential appears on Tableau’s own certification programme page under its formal name, Salesforce Certified Tableau Consultant.
Should You Take This or the Tableau Data Analyst Exam?
Choose by the work you do, not by seniority. The Data Analyst credential examines building: connecting, preparing, analysing, and publishing. The Consultant credential examines advising: assessing what exists, recommending changes, and defending the choice. Someone who spends their week producing dashboards should take the first. Someone who spends it reviewing other people’s should take the second.
The two are also weighted very differently. The Data Analyst exam distributes attention across the analytical workflow. This one puts 40 percent into a single domain about calculations and workbook troubleshooting, and pairs it with two planning domains that a builder may never touch.
What the consultant framing is worth in a career
The advisory framing is the reason this credential travels. Judgement about platform choice, security design, and governance transfers between employers in a way that product fluency alone does not, and it maps onto the higher end of the business intelligence pay range that PayScale reports for BI analysts.
Connection methods worth knowing before either exam
Both credentials assume you can connect to data, but only this one asks you to recommend a method between Web Data Connectors, web extract APIs, custom SQL, ODBC, and Tableau Bridge. If ODBC is the one you know least, the ODBC specification overview explains what the standard actually guarantees, which is what the trade-off questions turn on. Candidates weighing the analyst route first will find it covered in BigDataPrep’s Tableau data analyst guide.
Frequently Asked Questions
How many questions are on the Analytics-Con-301 exam?
60 questions in 105 minutes, which is 105 seconds each. The longer than usual allowance reflects a paper built largely on scenario questions rather than recall items.
What is the passing score for the Tableau Consultant exam?
63 percent, which is 38 of the 60 questions. No per domain minimum is published, so strength in the 40 percent calculations domain can offset a weaker showing elsewhere.
How much does the Tableau Consultant certification cost?
$200 USD to register and $100 USD to retake. The retake fee at half price is unusually generous and worth factoring into whether you book before you feel completely ready.
Which domain carries the most marks?
Design and Troubleshoot Calculations and Workbooks, at 40 percent or roughly 24 questions. It is also the domain with the most objectives, sixteen of them, covering chart types, calculations, interactivity and performance.
Does the exam test row level security in depth?
Yes. Four objectives cover designing an RLS data structure, implementing an entitlement table, distinguishing group functions from user functions, and comparing RLS approaches. It is the densest single subject on the syllabus.
Which advanced chart types are named on the syllabus?
Sankey, chord, radar, tile map, small multiples, and data densification. All of them require construction rather than selection, so the exam asks when the effort is justified rather than how to click them.
Why does the order of operations appear twice?
Once for identifying its effect on calculations and once for troubleshooting the issues it causes. Most surprising Tableau behaviour traces back to the sequence in which filters and calculations apply, so the duplication signals how much it is worth knowing.
Is Tableau Server or Tableau Cloud knowledge required?
Both. One objective asks you to recommend between them including migration, and another asks you to plan a Server upgrade. The answer depends on data residency, administration capacity, and cost model rather than on a feature list.
What training does the exam recommend?
Two learning paths are named on the exam listing: the Analyst Learning Path and the Designer Learning Path. Practical consulting exposure matters at least as much, given how the questions are framed.
What is the credential’s official name?
Salesforce Certified Tableau Consultant. The exam code Analytics-Con-301 and the shorter name Salesforce Tableau Consultant refer to the same credential, which causes some confusion when searching for the badge.
Conclusion
Analytics-Con-301 rewards a way of thinking rather than a set of clicks. Its objectives ask you to recommend, evaluate, plan, and troubleshoot, and its hardest questions hand you a situation with three defensible answers and expect you to pick the one that fits the constraint you were given.
Prepare it as a comparison exercise. For every feature on the syllabus, know the alternative and know when each wins: Server against Cloud, group functions against user functions, live against extract, upstream against in-workbook. Check the current domain weightings and question format on the money site before you book, then spend your time on the trade-offs rather than the menus.